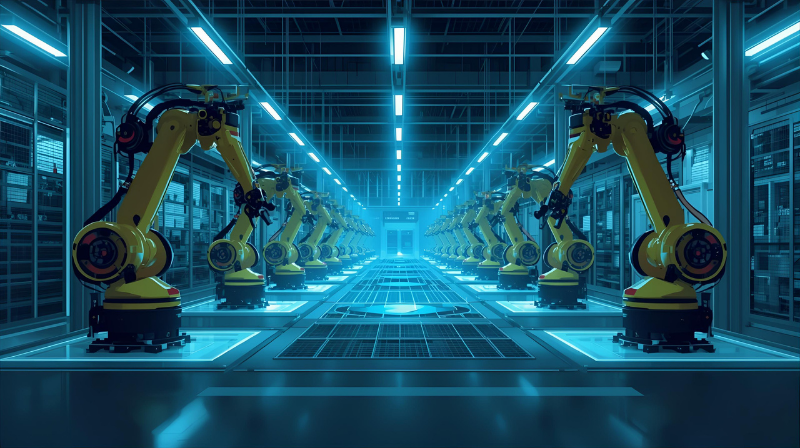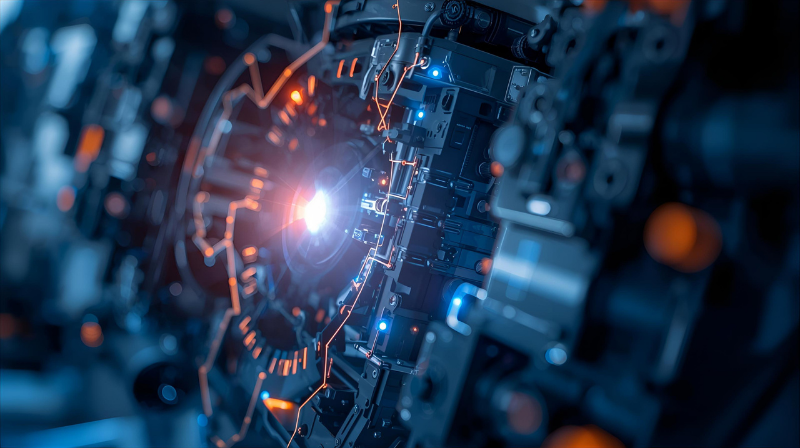
For a century, factories ran on muscle and mechanics. Today, they run on data. In the era of the Smart Factory, the most valuable asset is not the machine itself, but the information it produces. The key to unlocking this value is the Industrial Internet of Things (IIoT)—a vast network of connected sensors and devices that act as the factory’s central nervous system, constantly sensing, collecting, and communicating data.
But a nervous system is useless without a brain to interpret its signals. That’s where data visualization comes in. An IIoT and Data Visualization solution is the complete package: the nerves to collect the data and the intelligent “brain” to translate that raw data into clear, actionable insights that can revolutionize a business.
What is the Industrial Internet of Things (IIoT)?
At its core, IIoT is about connecting industrial “things”—like PLCs, sensors, motors, and even entire production lines—to the internet and to each other. This connectivity allows for a constant, real-time flow of information that was previously trapped inside individual machines.
This simple act of connection unlocks powerful capabilities:
- Remote Monitoring: You can check the status, health, and performance of any machine from anywhere in the world.
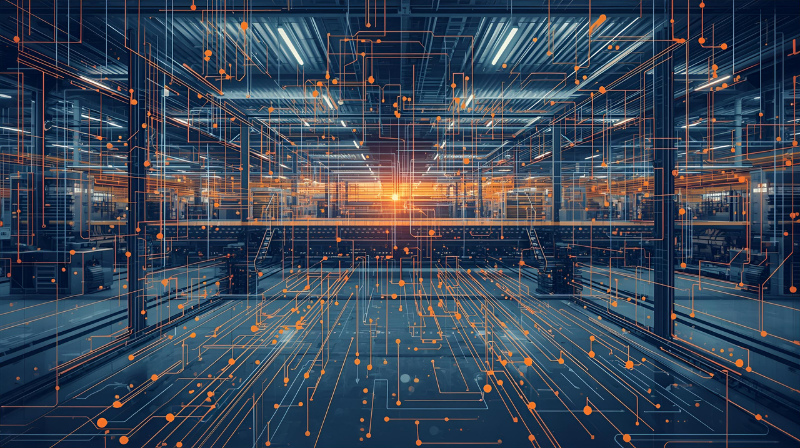
- Centralized Data Collection: All the data from your entire operation flows into a single, central location, breaking down information silos.
- Machine-to-Machine (M2M) Communication: A machine at the end of the line can automatically tell a machine at the beginning to slow down if a bottleneck is forming, without any human intervention.
The Power of Visualization: Turning Data into Decisions
A raw stream of data—millions of data points for temperature, pressure, and cycle time—is meaningless to a human. The magic happens when that data is visualized. A well-designed dashboard is a window into the soul of your factory. It translates the chaos of raw numbers into intuitive charts, graphs, and alerts.
As the authors of a seminal article from the Harvard Business Review on data storytelling argue, visualization is what allows us to see patterns, spot anomalies, and make informed decisions quickly. In a factory setting, this means a manager can look at a single screen and instantly understand:
- Overall Equipment Effectiveness (OEE): Are your machines running as efficiently as they could be? The dashboard can show you exactly how much time is lost to downtime, slow cycles, and defects.
- Real-Time Production Counts: Are you on track to meet your production goals for the day?
- Predictive Maintenance Alerts: Which machines are showing early warning signs of a potential failure?
A Solution, Not Just a Technology
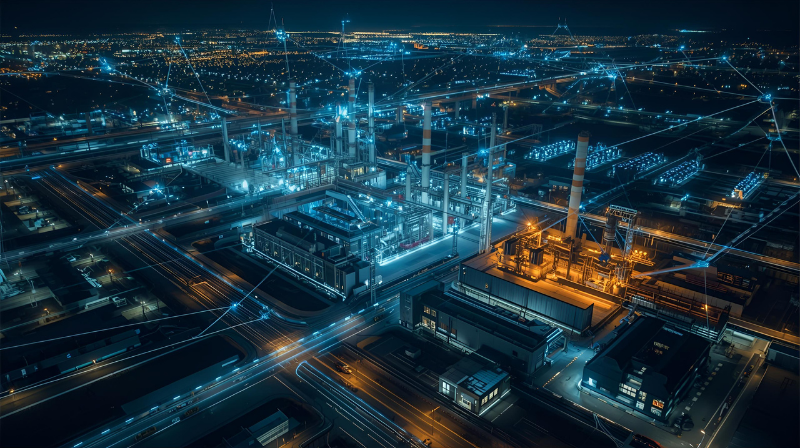
Implementing an IIoT platform is not just about installing new sensor products. It’s a strategic undertaking that requires a blend of specialized services, including network architecture, cybersecurity, and software development.
The goal is to create a seamless flow of information from the machine on the factory floor to the dashboard in the top floor office. This connected ecosystem allows for faster troubleshooting, smarter resource allocation, and a deep, data-driven understanding of the entire operation. It transforms the factory from a collection of isolated machines into a single, intelligent, and highly optimized organism.